Wireshark #1: Simple Introduction
Wireshark is a widely used free and open-source software for capturing, analysing, displaying network packets in real-time. In this post, we will see how to observe a tcp and udp connection.
Check out the video after going through the post.
Getting Started with Wireshark
To install Wireshark on a Debian/Ubuntu based distribution, use the following command.
sudo apt install wireshark
For other platforms, you can get wireshark from https://www.wireshark.org/download.html. You need to start Wireshark as administrator or grant necessary privilege to Wireshark while performing the installation. If Wireshark is not working for you, use the following command.
sudo wireshark
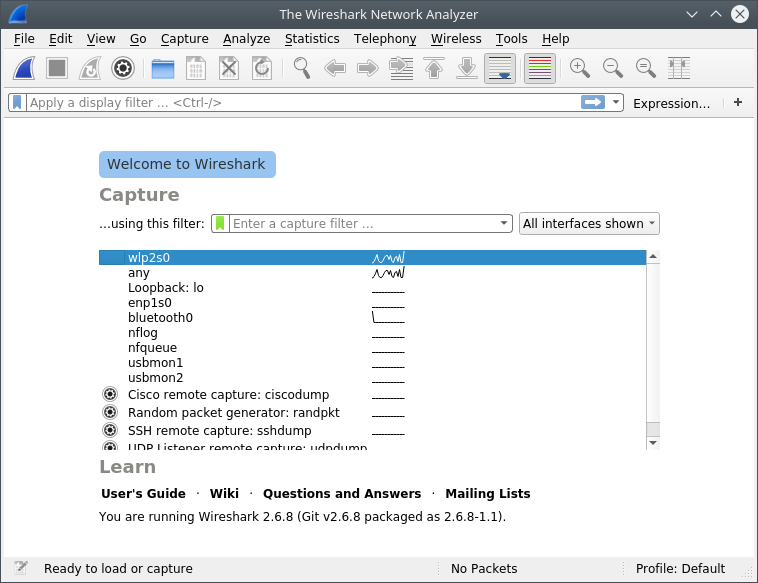
Wireshark start screen
Your interface will show all the available interfaces. You may choose the interface you want to inspect. Here, I am selecting wlp2s0, which is the wireless interface. Now you can see an interface with following details - No, Time, Source, Destination, Protocol, Length, Info, etc. If you select any of the entries shown in the window, its details will be displayed below.
Observing UDP Traffic using Wireshark
The first step is to generate a UDP traffic. We can easily achieve this by using several commands. The following command will generate a UDP traffic.
nslookup google.com
To install nslookup use the following command.
sudo apt install dnsutils
nslookup is a command-line utility to query the specified DNS server and retrieve the requested records associated with the domain name you provided. The retrieved records contain information like the domain name’s IP addresses.
Now lets apply a filter on the Wireshark interface. udp.port == 53 - This will filter out the unwanted packets from the window. The window now shows a Standard query and Standard response generated by the nslookup command. We can click on the entry and select show packet details to see the details of the UDP packet.
Applying filter option to select packets of interest Packet Details of Standard Query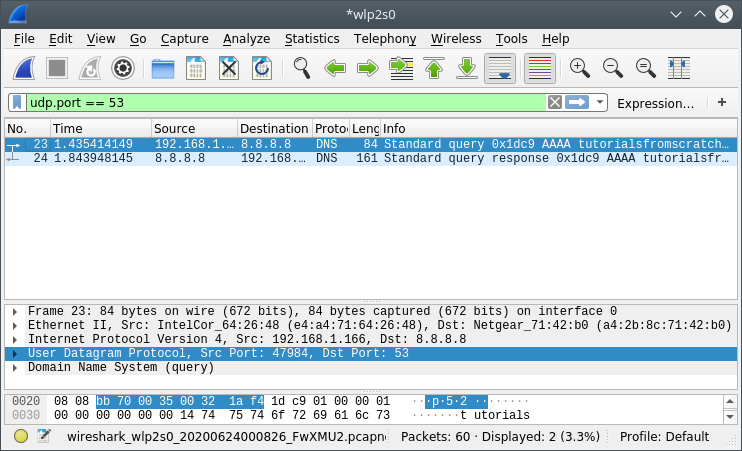
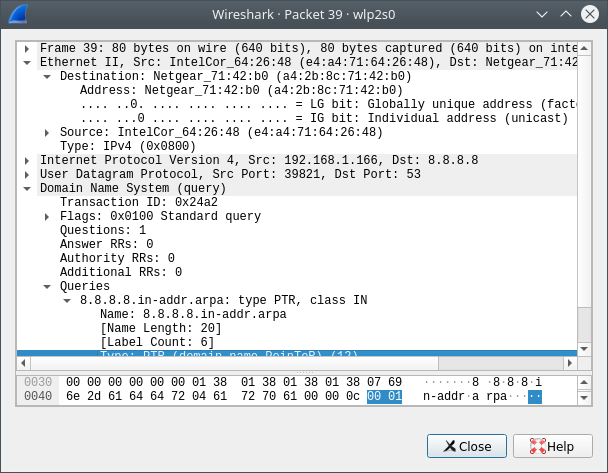
You can find all the details of UDP header – Source port, Destination Port, UDP length and checksum.
Observing TCP traffic using Wireshark
The process is similar to the one mentioned above. To generate TCP traffic, open the browser and visit your favourite website. Here, I am visiting https://tutorialsfromscratch.com/ . Before proceeding to the next step, we need to find out the IP address of website we have just visited. We can get it by using the below command.
ping tutorialsfromscratch.com
You will receive an output similar to this.
  PING tutorialsfromscratch.com (209.99.16.221) 56(84) bytes of data.
  64 bytes from bh-54.webhostbox.net (209.99.16.221): icmp_seq=1 ttl=44 time=1143 ms
  64 bytes from bh-54.webhostbox.net (209.99.16.221): icmp_seq=2 ttl=40 time=1333 ms
  64 bytes from bh-54.webhostbox.net (209.99.16.221): icmp_seq=3 ttl=44 time=1845 ms
ping is a command-line utility used to send packets to check whether the specific networked device is available.
Now, we have the necessary data to apply the filter. Our new filter is ip.dst == destinationip. This will filter out other traffic from the window. Your window will be similiar to the window shown below,
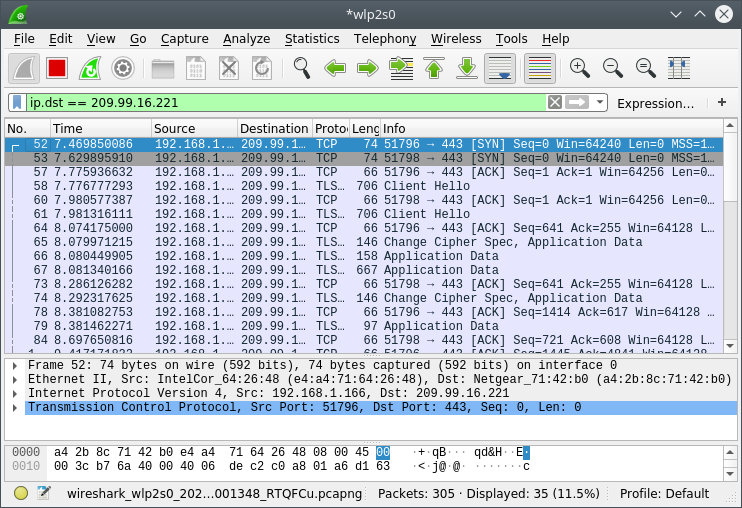
Captured TCP traffic
Take the info tab of the first entry, we can see that the SYN bit is set, sequence number is set to zero, etc. To view the details of the packet, double click on the entry to see the detailed window, like the one shown below.
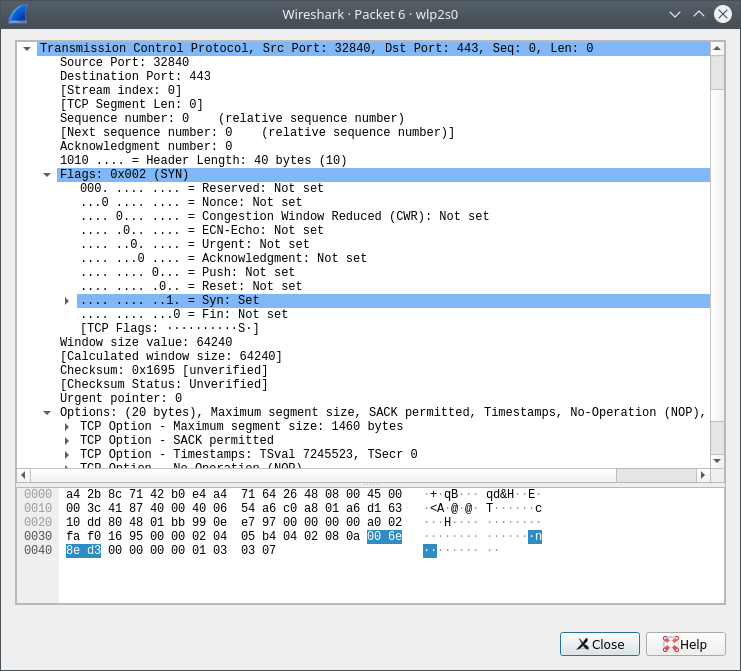
TCP Packet details
Here you can see all the detailed TCP header.
Capturing UDP traffic from local host
Wireshark can be used to debug, analyse your networking programs. Here, we will run a simple python program that will send a message using UDP and the server will receive this message and will send it back. I will add the explanation to this program later.
#UDPEchoServer.py
import socket
import sys
sock = socket.socket(socket.AF_INET, socket.SOCK_DGRAM)
server_address = ('localhost', 20000)
sock.bind(server_address)

data, address = sock.recvfrom(4096)
print("Recieved %s and echoing", data.decode())
if data:
    sent = sock.sendto(data, address)
sock.close()</pre>
#UDPEchoClient.py
import socket
import sys
sock = socket.socket(socket.AF_INET, socket.SOCK_DGRAM)
server_address = ('localhost', 20000)
message = 'HashVolition.'
try:
sent = sock.sendto(message.encode(), server_address)
data, server = sock.recvfrom(4096)
print('received "%s"' % data.decode())
finally:
sock.close()You need to run the UDPechoserver.py first. The program will wait for a data from the port 20000. Then you need to run UDPechoclient.py, the program will send the message ‘HashVolition.’ to UDPechoserver.py. Once the message is received, the echo server will display the message and echo the message. The client will then receive the message and print the data.
Run the UDPechoserver.py by using
python UDPechoserver.py
Run the UDPechoclient.py by using
python UDPechoclient.py
Before running both the programs make sure that Wireshark is running and listening to the Loopback:lo interface. The screenshot shows two captured packet, first one send from the Echo Client to the server and second one is the packet echoed by Echo Server.
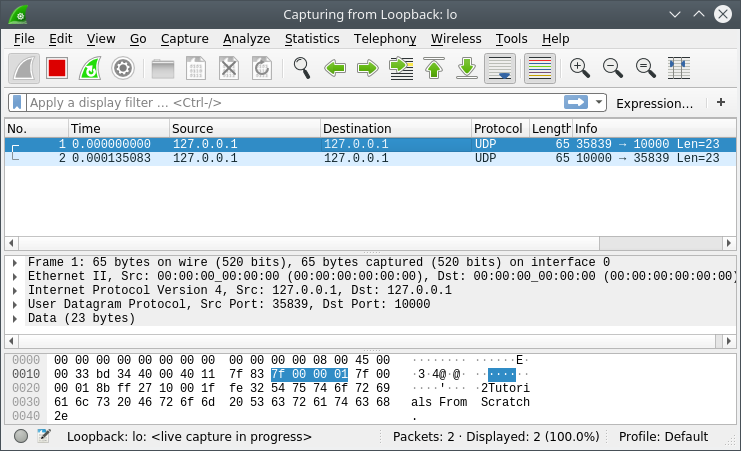
Captured UDP traffic from the Echo Server and Echo Client
Capturing TCP traffic from local host
Now, we will modify the program to use TCP instead of UDP. The execution of TCPEchoServer.py should be done first.
#TCPEchoServer.py
import socket
import sys
sock = socket.socket(socket.AF_INET, socket.SOCK_STREAM)
server_address = ('localhost', 20001)
sock.bind(server_address)
sock.listen(1)
connection, client_address = sock.accept()
try:
    data = connection.recv(160)
    print( 'Received "%s"' % data.decode())
    if data:
        connection.sendall(data)
finally:
    connection.close()
#TCPEchoClient.py
import socket
import sys
sock = socket.socket(socket.AF_INET, socket.SOCK_STREAM)
server_address = ('localhost', 20001)
sock.connect(server_address)
try:
message = 'Tutrials From Scratch. Tutrials From Scratch.'
sock.sendall(message.encode())
amount_received = 0
amount_expected = len(message)
while amount_received < amount_expected:
data = sock.recv(16)
amount_received += len(data)
print ( 'Received "%s"' % data.decode())
finally:
sock.close()
TCP traffic captured by Wireshark
